All your IT monitoring in one place IT monitoring. Security. AI analysis.
A single appliance that monitors your IT performance, detects threats, and explains what happened — all from your own data center. Deploy in minutes, nothing in the cloud.
< 10 min
Time to first dashboard
1 second
Live data, second by second
AI-powered
Root cause analysis
70+
Built-in threat detections
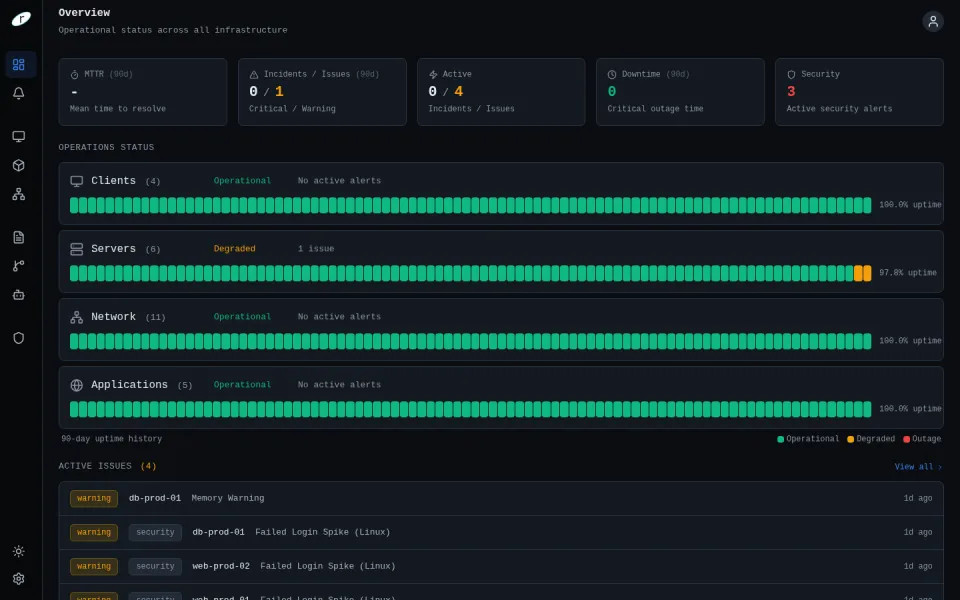
One platform, full visibility
Performance monitoring and threat detection from a single data source. AI-driven insights help you find and fix issues — whether operational or security — before they impact your business.
Catch Problems Early
Automatic anomaly detection catches problems before users notice. Windows and Linux agents deploy in seconds with zero configuration. Threat detection rules flag unauthorized changes, disabled antivirus, and brute force attempts.
See Your Entire Network
Topology mapping, interface utilization, and neighbor detection — see your entire network at a glance without touching a single switch.
Ask, Don't Dig
Ask questions in plain language and get answers instantly. Our AI correlates metrics and security events across your stack and explains what's happening and why.
Alerts That Matter
Smart anti-false-alarm logic means you only get woken up when it's real. No alert storms, no threshold guesswork.
One Place for Every Log
Collect logs from every server automatically. Full-text search finds the needle in the haystack in seconds, not hours.
Security from the Same Data
70+ MITRE ATT&CK mapped rules detect threats from the same data that monitors your IT performance. Brute force, AV disabled, log clearing — correlated across your entire stack.
Sound Familiar?
These are the frustrations we hear most from teams evaluating a new monitoring platform. Insight was designed to eliminate every one of them.
Unpredictable costs
You started with a reasonable quote, then the invoice arrived. Data ingestion fees, per-user charges, overage penalties — the bill grows faster than your infrastructure.
Straightforward per-host pricing. No data volume fees, no per-user charges, no surprises on the invoice.
Weeks of configuration
Agents, dashboards, integrations, alert rules — every new tool means weeks of setup before you see any value. And when something changes, you start over.
Deploy the appliance, install agents, see metrics in minutes. Pre-configured dashboards and alert rules included.
Alert fatigue
Hundreds of alerts per day, most of them noise. Your team starts ignoring notifications, and the one that matters gets lost in the flood.
Smart anti-false-alarm filtering with configurable durations. You only get notified when it's real.
Vendor lock-in
Proprietary query languages, custom agents, exported data that only works in their ecosystem. Switching costs grow every quarter until migration feels impossible.
Open standards, your data in ClickHouse, agents you control. Migrate in or out without losing your history.
One Team, One Truth
Fragmented tools create fragmented teams. When four tools show four versions of reality, incidents turn into meetings and troubleshooting turns into blame. A shared platform gives everyone the same view — and that changes how your team communicates, not just how they monitor.
From blame games to shared timelines
When the network tool says the network is fine and the server tool says the server is fine, the problem lives in the gap between them. One timeline eliminates the gap.
From silos to shared understanding
Four tools create four areas of expertise and four groups who see different slices of the same reality. One platform creates a common language for your entire IT team.
From meetings to answers
When correlation is built in, you skip the war room. The data is already connected — the question is just where to look, not which tool to open.
What Our Customers Say
"We replaced three separate tools with Rebendo Insight and cut our mean time to resolution in half."
— IT Manager, Swedish MSP
"Finally a monitoring platform that stays in our network. Deployment took 15 minutes and we had full visibility the same day."
— Infrastructure Lead, Healthcare Provider
"The AI analysis saves us hours every week. Instead of digging through dashboards, we just ask a question and get the answer."
— Senior Sysadmin, Financial Services
"The AI flagged a memory leak pattern we'd been chasing for weeks. Root cause identified in under a minute."
— DevOps Lead, E-commerce Company
"We went from zero network visibility to full SNMP topology maps in an afternoon. No consultants, no professional services."
— Network Engineer, Municipality
"We evaluated three platforms. Insight was the only one our team could deploy without reading a manual first."
— CTO, SaaS Startup
Performance and Security Visibility in Minutes
See performance metrics and security alerts from your own data center in minutes — running entirely in your environment, nothing in the cloud. Get in touch and we'll help you get set up.